The SIR model can be presented in stock-flow form (Figure 1) and as a differential equation in causal form (Equation 1)

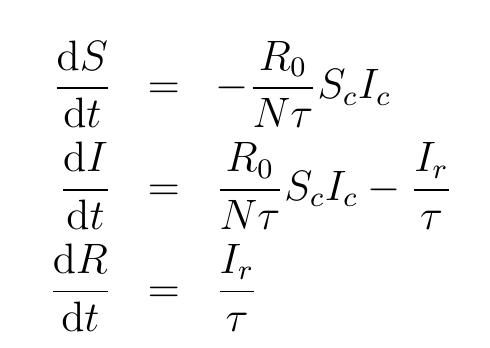
Using the loop impacts (see SIR Loop Impacts), the differential equations can be converted into power balance equations (Hayward and Roach, 2022). These equations illustrate how energy is injected and removed from each stock. Because the SIR model is a conserved system, the removed () can be determined from the other two stocks. ‘s behaviour is an exogenous reaction to ‘s behaviour. Thus, it is sufficient to consider only the Susceptible and Infected stocks.
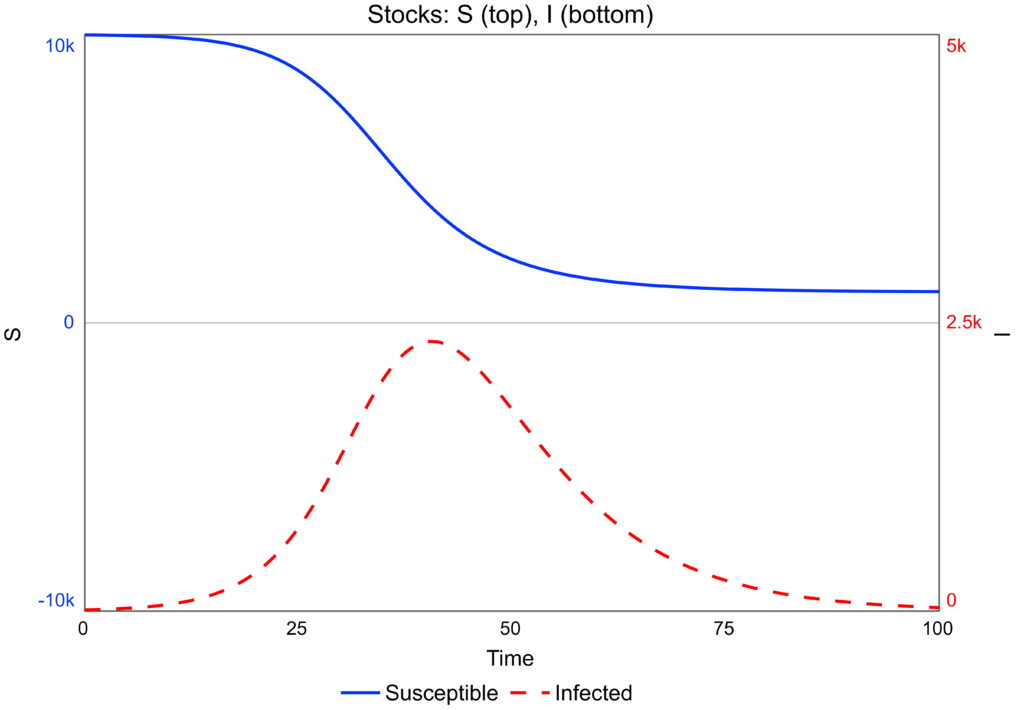
If the infected start with a small number, their numbers rise to a peak as the infection spreads (Figure 2). Once the threshold is exceeded, the number of infected falls and the infection dies out. Susceptibles fall and stabilise at a non-zero value
Kinetic Energy
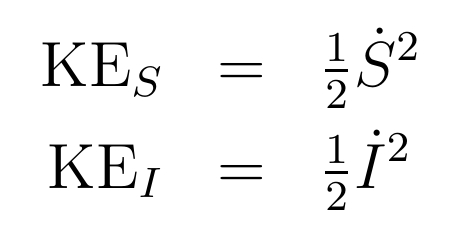
The kinetic energy of a stock measures how quickly it is changing (Hayward & Roach, 2022, 2023). It is proportional to the square of the net flow. Equation 2 gives the kinetic energies of the two independent stocks in the SIR model. If kinetic energy changes over time, the stock is accelerating or decelerating, meaning at least one loop has exerted a force on it. If a stock’s value is not changing, its kinetic energy is zero. Stock energy can be called dynamic energy as it relates to the dynamics of the stock..
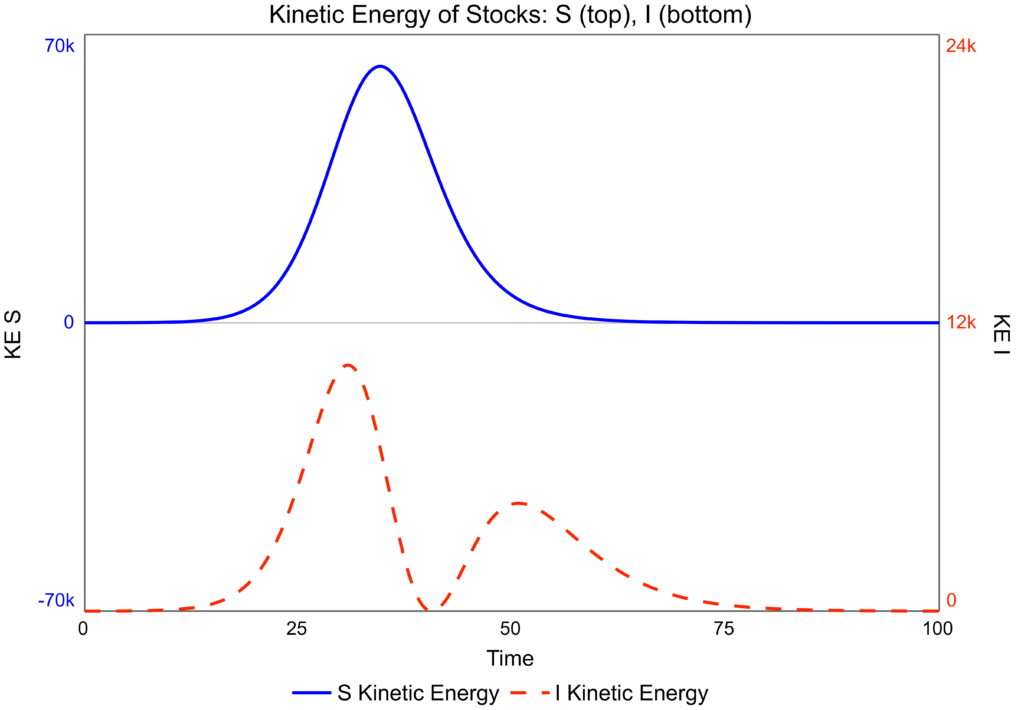
The kinetic energy of the susceptibles rises (Figure 2) until it reaches its inflexion point, around time 30 (Figure 1). The kinetic energy then declines to zero (Figure 2). By contrast, the infected stock has two inflexion points on either side of its maximum (Figure 1), giving two peaks in its kinetic energy (Figure 2). The infected’s kinetic energy is at a minimum when the stock is at its maximum, and its rate of change is momentarily zero.
Kinetic energy has units of where the stocks have units of .
Power on Stocks
To obtain the energy flows in this model, use the impact equations for the two stocks (Equation 3), derived by differentiating the model equations (Equation 1). The impacts are given on the page SIR Impacts, Equations 2 and 4.
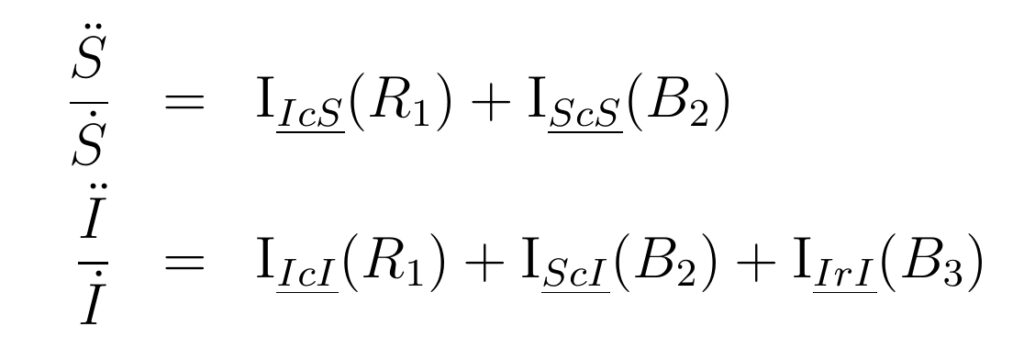
Multiply the two equations (Equation 3) by the rates of change, and , respectively, to give the power-balance equations for the two stocks (Equation 4). These equations relate the changes in stock kinetic energy to the energy flows associated with the forces exerted by the feedback loops. These energy flows measure the power of each loop on the stock (Equation 5) and are proportional to the loop impacts (Hayward & Roach, 2022, 2023).
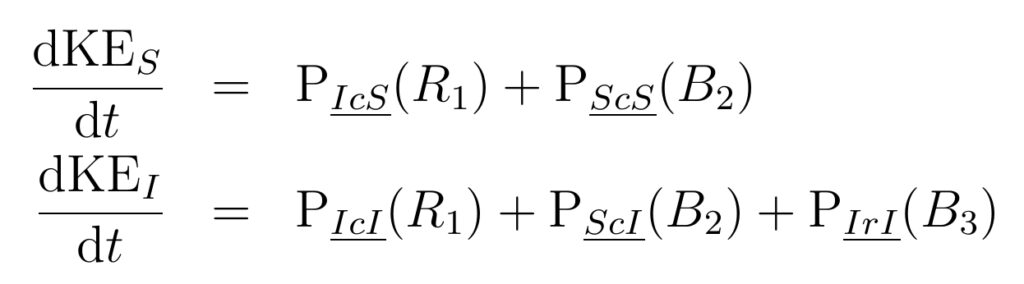
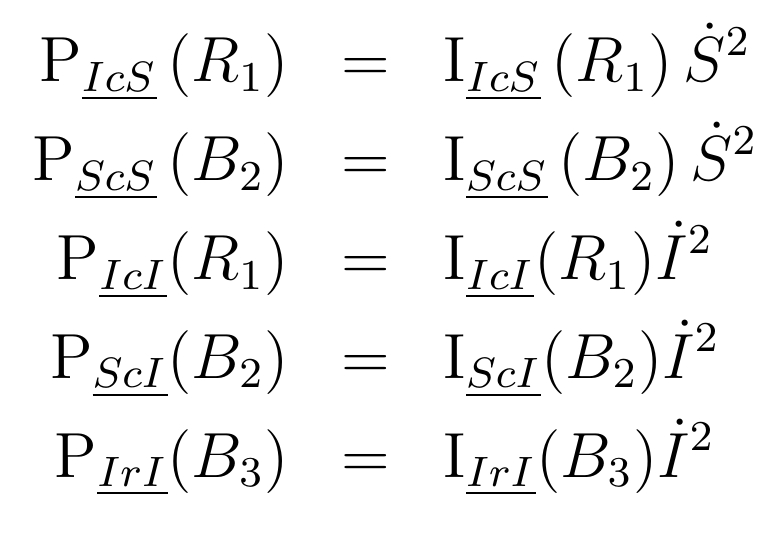
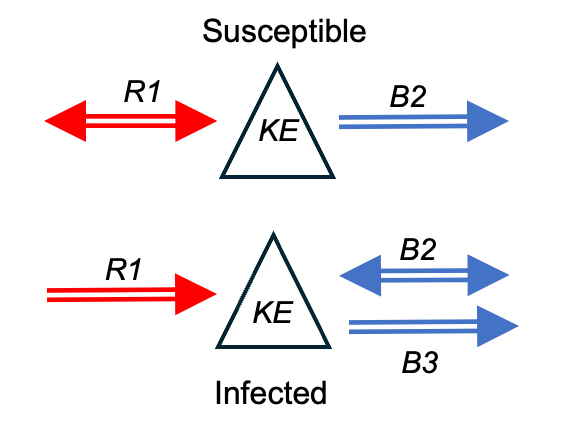
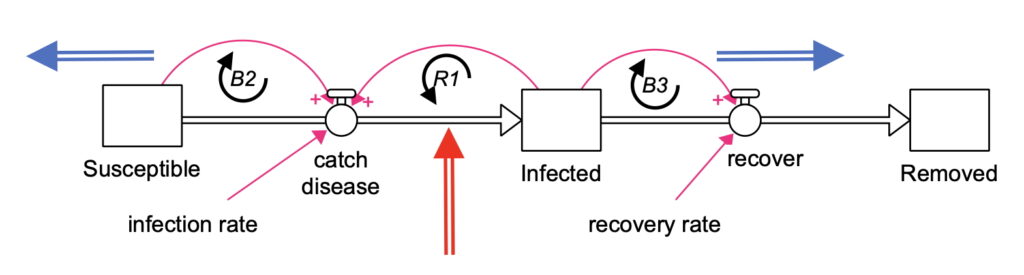
There are two independent power-balance equations, both of which are conserved over time (Equation 4). These equations can be expressed diagrammatically, with arrows indicating the direction of dynamic energy flow (Figure 4). The red double-headed arrow, , on the susceptibles indicates that energy flows both ways, as acts exogenously on Susceptibles. Although it is reinforcing on Infected, its effect on susceptibles depends on Infecteds’s net flow. Likewise, the balancing loop is exogenous on Infected and can both remove and inject energy in that stock.
Power Balance
The different terms in the right-hand sides of the power balance equations are plotted over time (Figure 5). Energy removal in the balancing loops lags injection in the reinforcing loops, with excess energy passed into the kinetic energy of the stocks. Around time 40, changes polarity, and the loop removes energy from Susceptibles. At the same time, starts injecting energy into the infected.
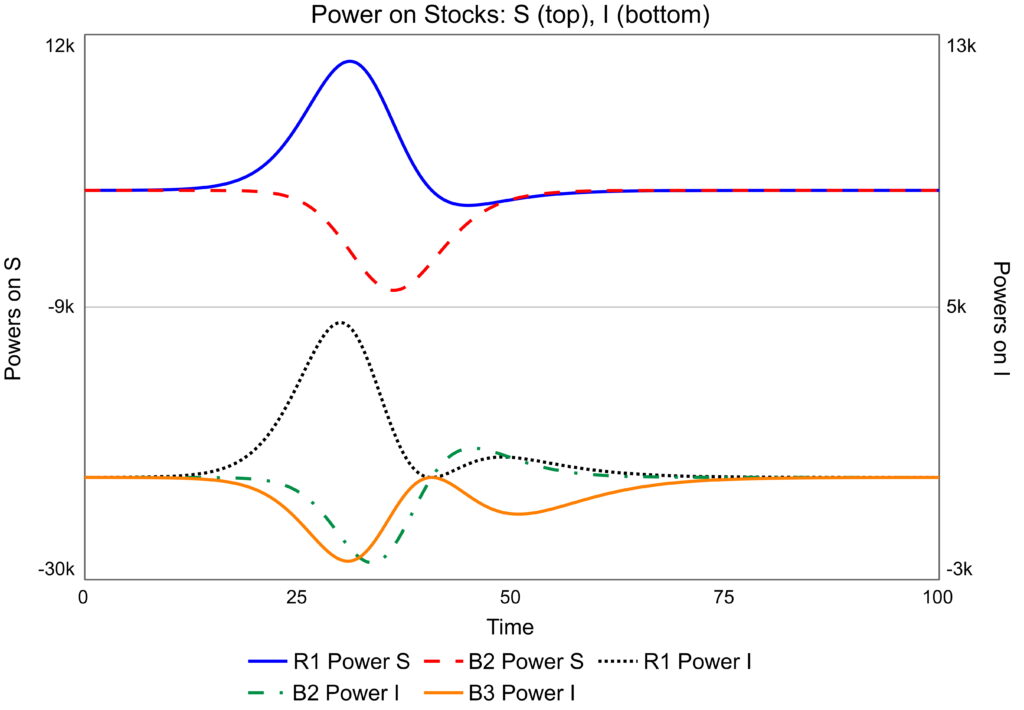
Because power is proportional to loop impact, its dominance patterns are the same as that of loop impact SIR Impacts, Figure 4.
System Power Theory
With power, a single energy flow narrative can be constructed by combining the two equations in equation 4. Note that reducing the energy narrative to a single equation may be done in multiple ways. A two dimensional conservation law is being recuded to a one dimensional one. Thus, there is no unique single system loop dominance narrative. Here, it is possible to choose a narrative such that the power of on exactly cancels that of on . This, narrative is achieved by changing the units on the Susceptible powers using the conversion factor in equation 6.
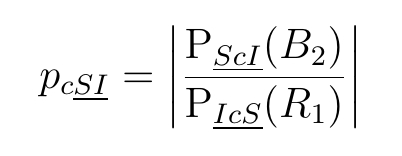
The loops and in Figure 1, combine together to form second-order balancing loop. In this narrative this loop is transferring energy between the stocks in a conserved fashion, as expressed in the green arrow in the system power balance diagram (Figure 6). This system then has one energy source, and two sinks, and . The corresponing energy balance equation is given by equations 7 and 8 (Hayward & Roach, 2023).
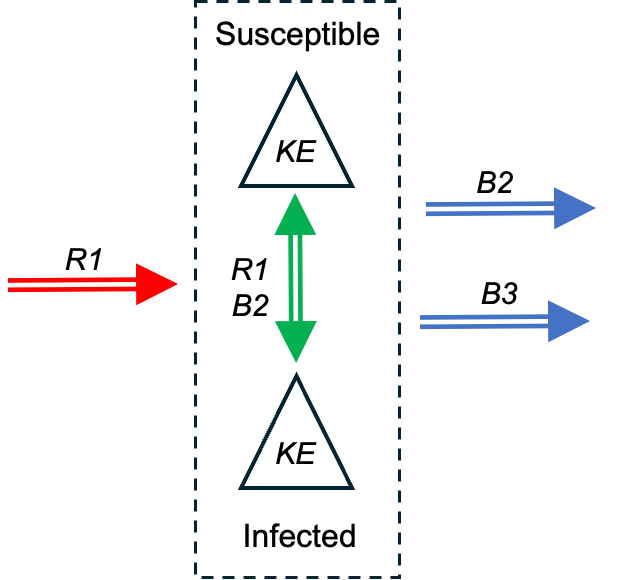
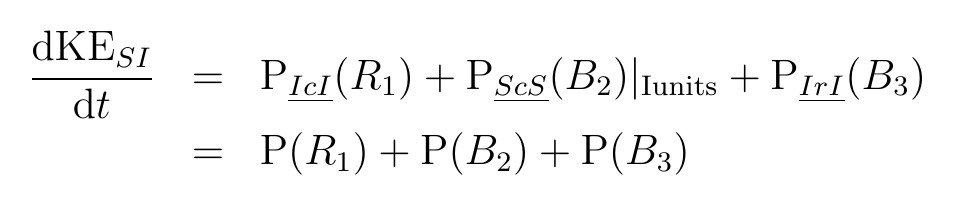
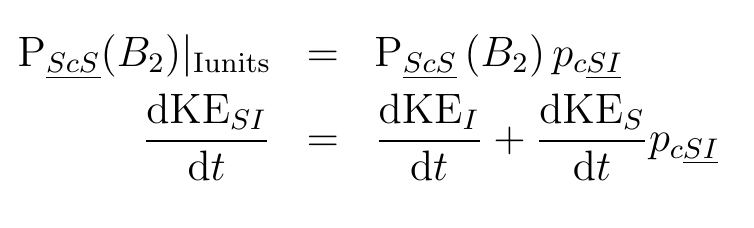
As the second-order loop formed by loops and is conserved, it can be removed from the power-balance diagram (Figure 7). Thus the narrative has been reduce to one source and two sinks.
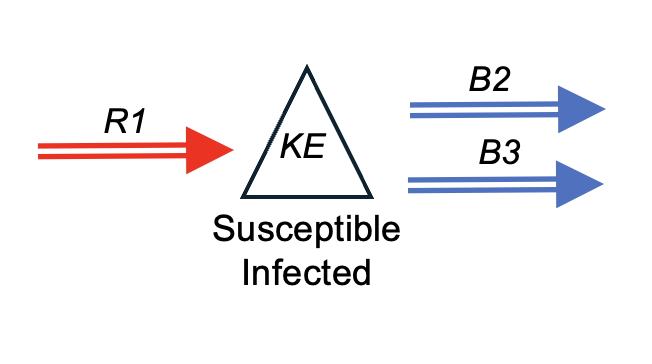
These three energy flows can be added to the stick-flow diagram (Figure 8).
System Power Results
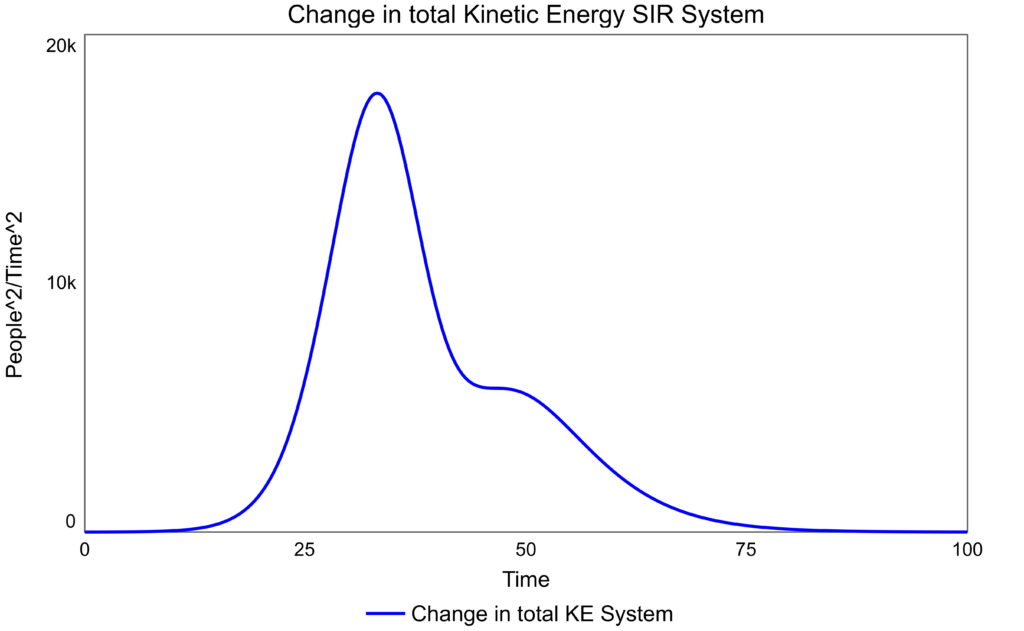
The comparative powers are displayed in Figure 9. Excess energy is transferred to the system kinetic energy, Figure 10. System kinetic energy measure the activity in the SI system. Intially, has more power than the two balancing loops, hence there is net increase in kinetic energy. As the power of falls and the power of increases, dominance shifts and the kinetic energy starts to fall. Loop is responsible for turning the system from instability to stability. Later, the most powerful loop is which is responsible for brining the system to stability.
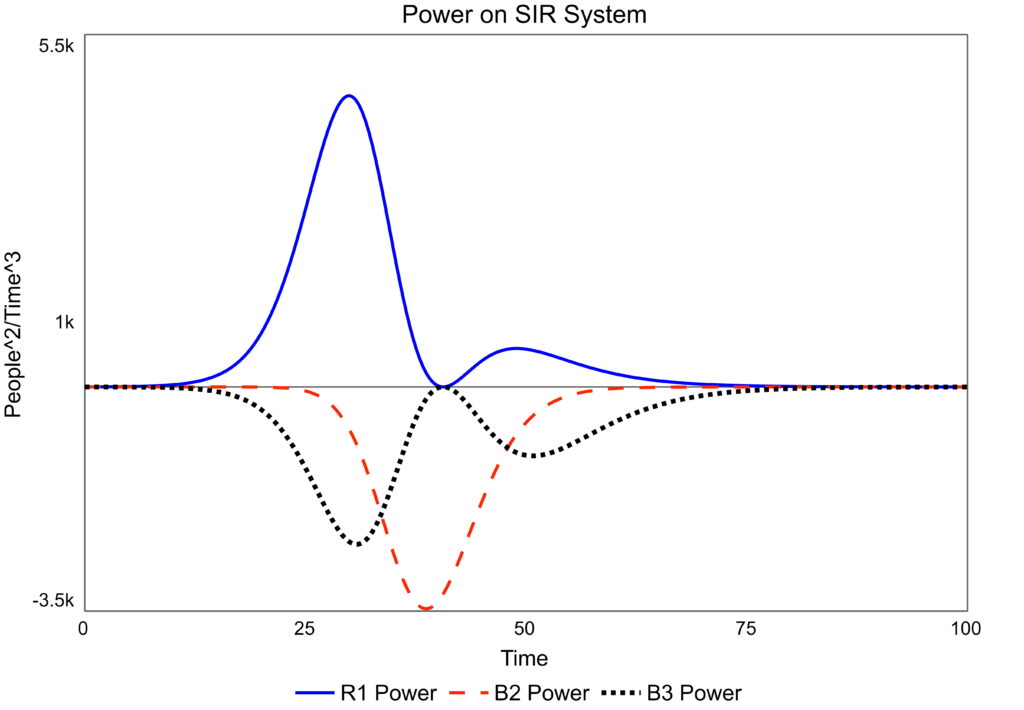
Figure 9: System power on the SIR system, susceptible and infiected stocks only
System Power Dominance
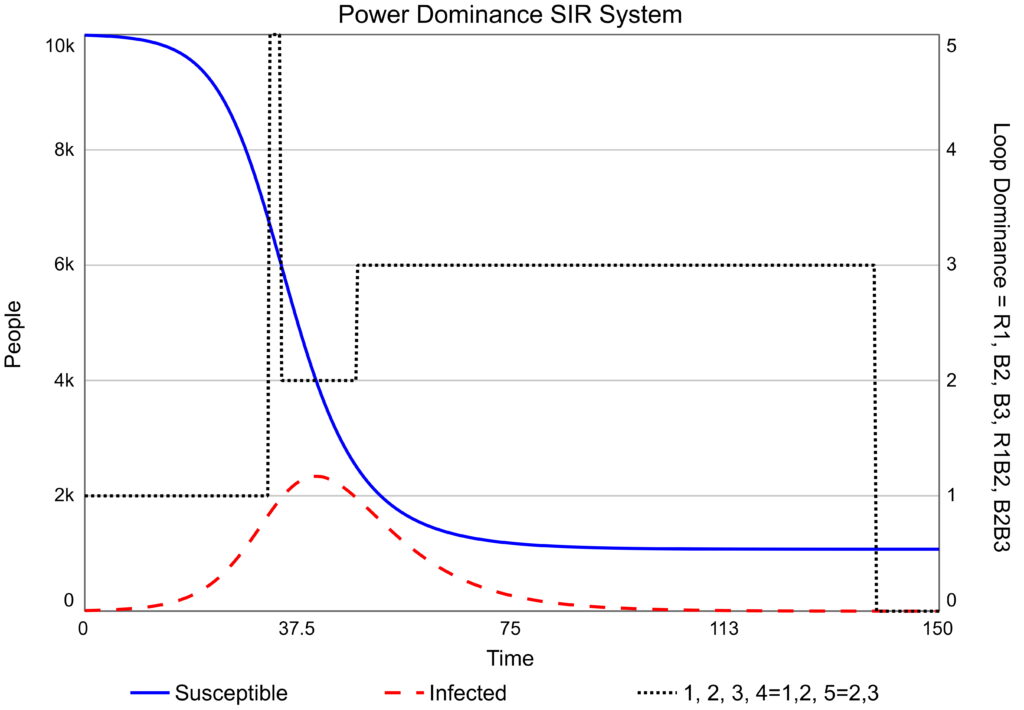
The powers in Figure 9 are turned into a dominance diagram for the system, that is both the Susceptible and Infected stocks, Figure 11. This dominance pattern is different to that of the Infected stock alone (SIR Loop Impacts, Figure 4) as it refers to energy injection and removal from the system. Activity in the system, measured by the stock’s kinetic energies increases due to the energy input of . It is halted and truned around by . Then, brought to stability by . The relative effects of the two balance loops determines the number of susceptibles that fail to be infected.
References
- Hayward J, Roach PA. 2022. The Concept of Energy in the Analysis of System Dynamics Models, System Dynamics Review, 38(1), 5-40. DOI: 10.1002/sdr.1700.
- Hayward J, Roach PA. 2023. A Comparison of Loop Dominance Methods: Measures and Meaning. Conference version. Presented at the 41st International Conference of the System Dynamics Society, Chicago, July 2023.