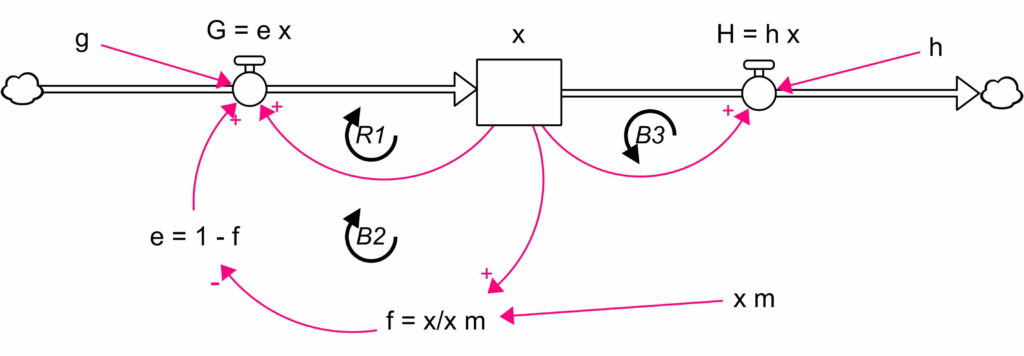
A Limits to Growth model includes a variable with a growth mechanism whose effects diminish as the variable approaches a capacity. Other mechanisms may adjust that capacity. Figure 1 shows a three-loop Limits to Growth model. Feedback loop R1 drives growth, while loop B2 resists it due to capacity effects. Loop B3 depletes the stock, reducing capacity. The model is expressed in symbolic form and is equivalent to many realistic models, such as the Business Construction Model. is the growth rate, is the depletion rate, and is the maximum carrying capacity.
This example will explain how loop impacts may be calculated mathematically. These impacts also enable the computation of loop power and the work done by loops. This analysis was first presented in Hayward & Roach (2017, 2019) [1,2].
Differential equations
The stock-flow model in Figure 1 can be reduced to a single differential equation by using the equations embedded in the model:
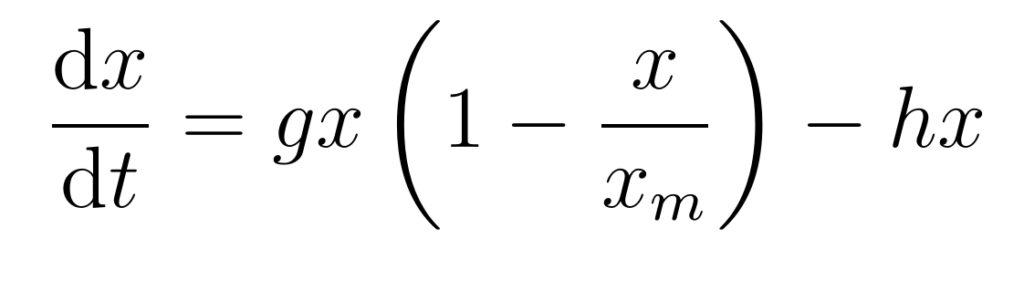
This process is described as reduced because the equation has lost the causal information contained within the stock flow model. The differential equation does not explicitly represent the feedback loops. In particular, loops R1 and B2 cannot be uniquely identified, especially if the brackets in the equations are removed through expansion.
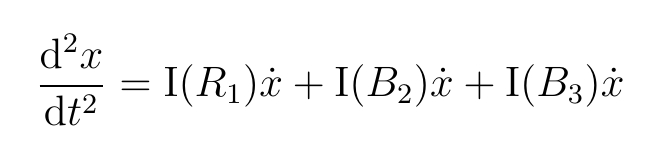
To retain the feedback information, the stock-flow model is expressed as a causally connected differential equation:
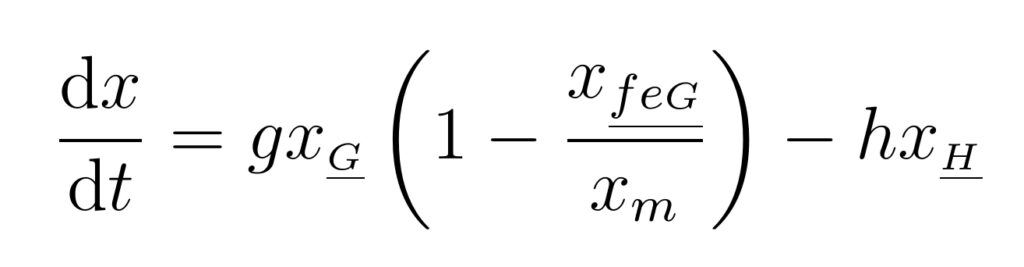
The underlined subscripts indicate the causal pathways from the variable x on the right-hand side to itself (the left-hand side). Thus, R1 is via the flow . By contrast, B2 is via the sequence . B3 is via . This causally connected differential equation contains all the model information, equations, feedback loops and causal connections. The variable sequence can be derived mathematically from the original equation set in Figure 1, see references [1,2].
Loop Impact
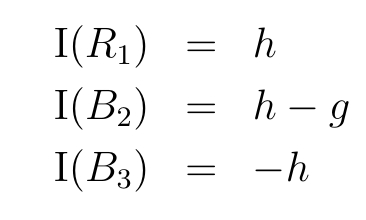
Loop impact quantifies a feedback loop’s contribution to a stock’s acceleration by comparing it with the stock’s rate of change. It is computed using pathway differentiation on the differential equation in causal form. For the Limits to Growth model, the impact of loop R1 on is the pathway derivative of equation 2 along pathway . That is, the partial derivative of equation 2 with respect to . See the first line of equation 3.
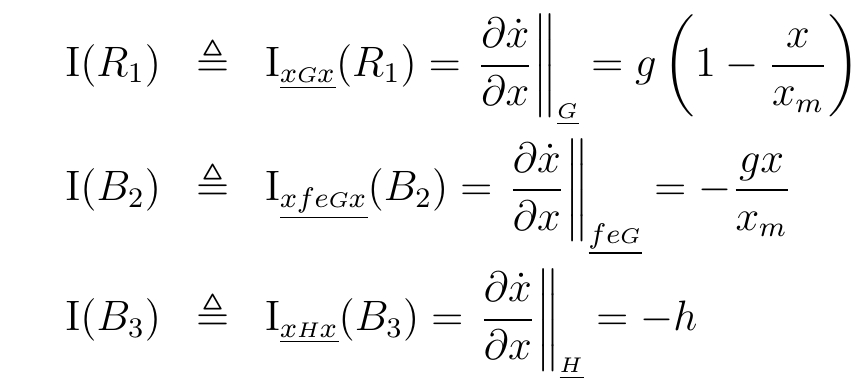
The impacts of the other two loops are computed in a similar way.
Regions of Impact Dominance
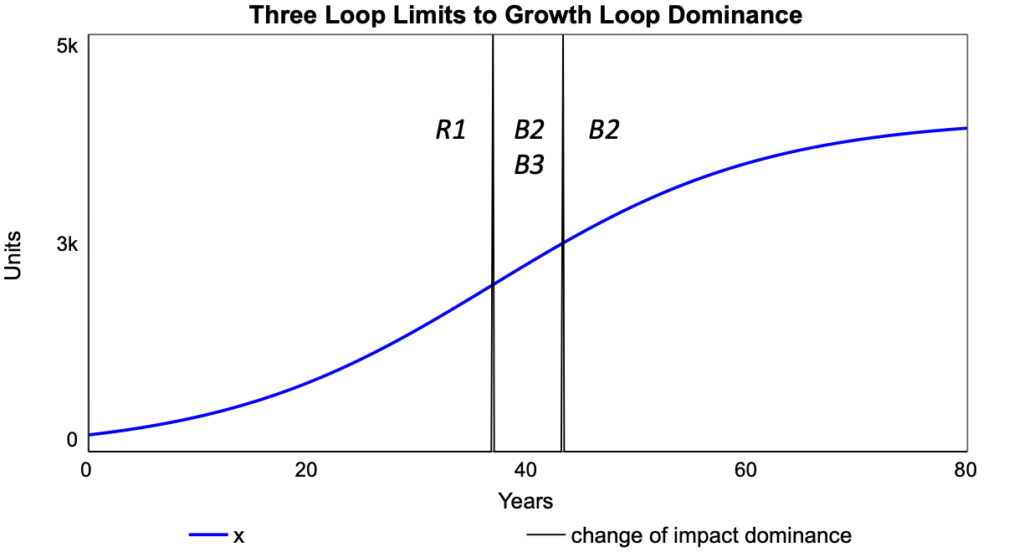
The values of the impacts (equation 3) change over time, Figure 2. Initially, R1 has the largest impact on ‘s behaviour, causing acceleration, Figure 3, left-hand region.
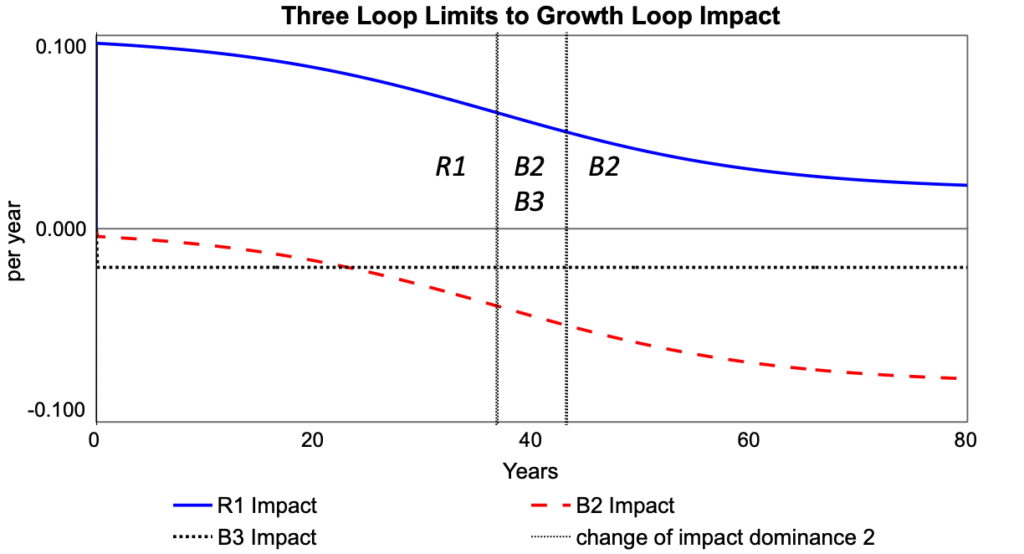
The first change in dominance occurs when the sum of the impacts of two balancing loops exceeds that of R1 in magnitude, as shown in the middle region of Figure 2. now changes from accelerating to decelerating, as shown in Figure 3. Once the impact of B2 increases sufficiently in magnitude, the deceleration is dominated by B2 alone, as shown in the right-hand region of Figures 2 and 3.
Equilibrium
At equilibrium, falls short of its maximum capacity, , by an amount proportional to the depletion rate.
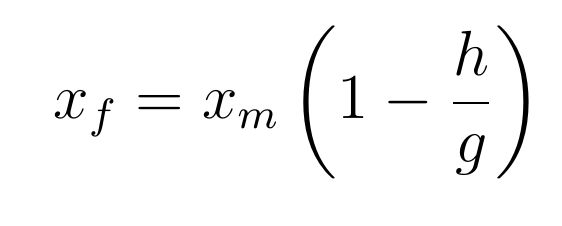
The impact of R1 is numerically the same as that of B2. For B2, its impact is the difference between the depletion and growth rates.
Impact Equation
Differentiating the equation of motion, equation 1, and using the impacts, equation 3, gives an equation for the acceleration of the stock:
Dividing by the net flow, , gives the impact equation:
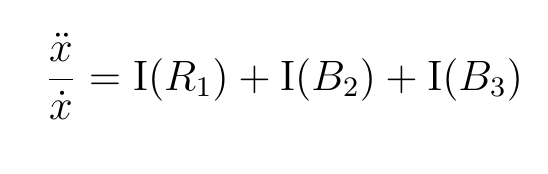
The impact equation gives the relative acceleration of the stock, the ratio of acceleration to rate of change. The same acceleration when the rate of change has more impact of stock behaviour give a larger percentage acceleration, or percentage force. The RHS of equation 7, the loop impacts, gives the different loop contributions to the relative acceleration of .
References
- Hayward J, Roach PA. 2017. Newton’s Laws as an Interpretive Framework in System Dynamics. System Dynamics Review, 33(3-4), 183-218. DOI: 10.1002/sdr.1586.
- Hayward J, Roach PA. 2019. The Concept of Force in Population Dynamics, Physica A: Statistical Mechanics and its Applications, 531, 121736, DOI: 10.1016/j.physa.2019.121736.