The measure of added causal links is the same regardless as to whether the links are added prior to flow entry, or they are added though multiple flows on the stock.
In any SD model, stock behaviour for the sum of the flows is the same as that for the flow of the sums. This result follows from the addition rule of integration. The sum of the integrals is the integral of the sums. Thus, any measure of the links for the sum of the flows must be the same as that of the flow of the sums.
This test assume that a measure of a causal links is linear. If a and b are two links and M is the causal measure (e.g. impact), then M(a) + M(b) = M(a+b).
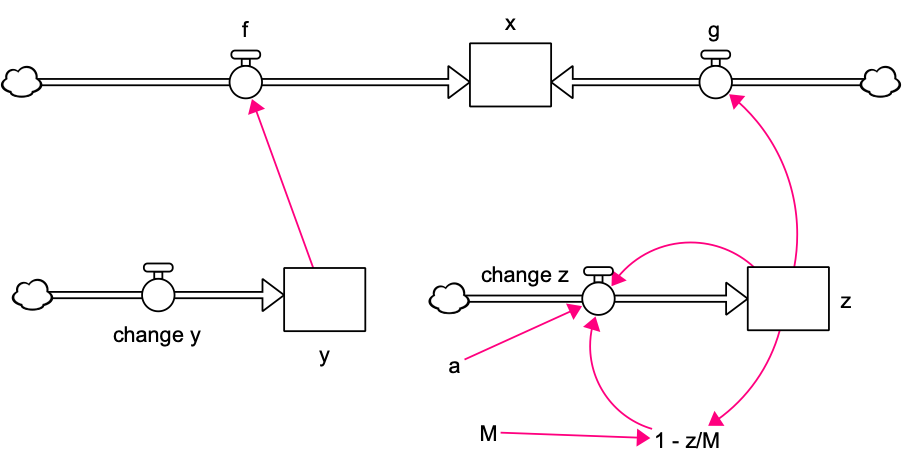
Let f and g be two flows into stock x with two stocks y and z influencing each flow respectively. An example is given in figure 1.
The same connections between from y and z to x can also be made with a single flow, labelled “f+g” in figure 2. The two influences from y and z are added together in this flow.

Clearly, the stock behaviour of both models is the same, figure 3.

The additive test requires that the sum of the measures of the influences of y and z on x through the flows should be the same. That is, for measure M,
M(y,f,x) + M(z,g,x) = M(y,f+g,x) + M(z,f+g,x)
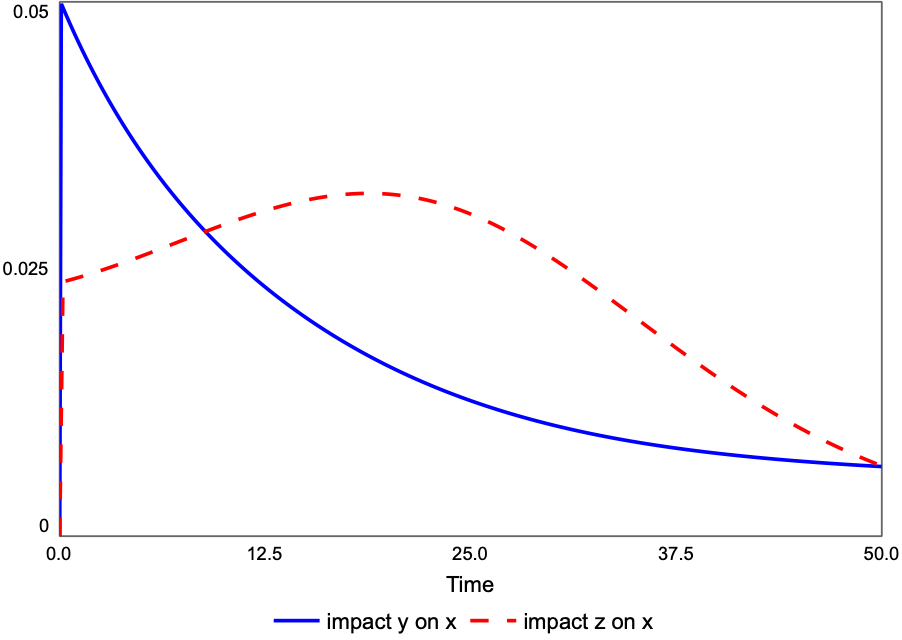
This is true for impact as its definition is based on differentiation, which is additive. For the model in figure 1 the two impacts are given in figure 4. Initially, the acceleration of the stock, figure 3, is dominated by the impact from y. However this impact is falling. At time about 9, the impact from z is larger, reaching a peak about time 19. By the end of the run the two impacts are equal. The sum of the two impacts is falling throughout, which implies the acceleration in stock behaviour is less than exponential.